Recap: Considerations for Temperature in Public Health Studies
Thank you to all who joined CAFE's Considerations for Temperature in Public Health Studies webinar with Lauren Mock and Shreya Nalluri from the Harvard T.H. Chan School of Public Health.
This webinar focused on how to study the effects of temperature on health. Attendees learned how to define a temperature exposure, choose an appropriate temperature dataset, and what to consider when modeling the relationship between temperature and health outcomes. This webinar is designed for those with some background in epidemiology who are relatively new to working with temperature exposures.
If you missed it, or want to review key points, here's a recap of the data resources they presented.
Why Temperature Matters for Public Health Research
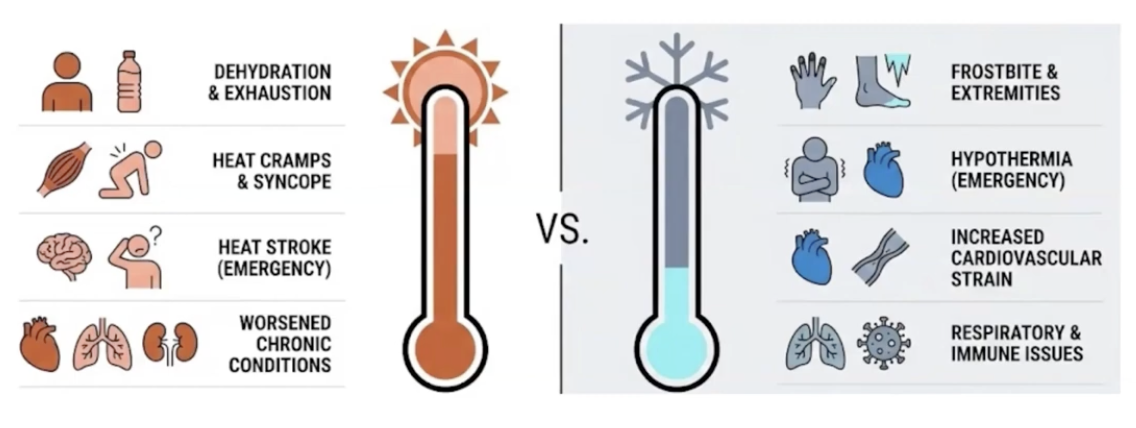
Mock and Nalluri began by highlighting the increased recognition of extreme temperature events as major public health risks. Mock introduced the potential short-term health impacts of extreme temperature exposure. Stressing that accurately assessing these impacts requires careful consideration of how we define, measure, and link temperature exposures to health outcomes.
Key Temperature Data Sources
- ERA5: Global hourly data available at 9 x 9 km resolution (land only) or 31 x 31 km resolution (land and ocean), spanning from 1940/1950 to present. Provides over 200 climate variables as well as wet bulb globe temperature (WBGT) and universal thermal comfort index (UTCI).
- GridMET: Daily data at 4 x 4 km resolution for the contiguous U.S., available from 1979 to present. Combines PRISM and NLDAS2 data to create spatially and temporally complete estimates.
- PRISM: Daily and monthly data for the contiguous US at either 800 x 800 meter or 4 x 4 km resolution. Daily data extends from 1981 to present, while monthly data begins in 1895.
CAFE Resources Available Now
The CAFE team has also developed several resources to support temperature-health research:
- GitHub tutorials on querying ERA5 data, deriving heat metrics, performing spatial aggregations and population weighting.
- Harvard Dataverse deposits with pre-processed, spatially-aggregated temperature data.
- County and zip code aggregated US GridMET variables.
- Multi-source meteorological data providing spatially aggregated monthly and annual data from multiple datasets.
Key Takeaways
Mock and Nalluri stressed several important considerations for temperature in public health research:
- Higher spatial resolution comes with computational trade-offs and may not always capture microscale health effects like urban heat islands.
- Researchers must carefully consider which health metric best captures the physiological effects relevant to their research question.
- Case-crossover designs and distributed lag nonlinear models (DLNMs) as particularly useful analytical approaches that can account for individual-level confounding and capture non linear temperature-health relationships over time.
As Nalluri noted, the goal is to transform temperature data “into something that can be more physiologically relevant and more useful for health outcomes research.”