News
Jobs and Funding Opportunities — June 16, 2026
In this ongoing series, we spotlight current job openings and funding calls in health and extreme weather research, plus related areas. Twice a month, we’ll round up timely positions, grants, and fellowships to help you find the right next step for your work.
Job Opportunities
- The Epidemiology Branch within the Division of Intramural Research of the National Institute of Environmental Health Sciences is recruiting a tenure-track investigator to develop an independent research program on environment and chronic diseases of aging.
- The World Health Organization seeks a consultant on climate, health, economics, and epidemiology to support the advancement of climate-health economic methods and evidence. Apply by June 15.
- The University of Washington Center for Health and the Global Environment seeks a postdoctoral fellow to support the Adaptation work group of the Lancet Countdown on Health and Climate Change and develop metrics related to climate and health adaptation in the U.S.
- The Department of Environmental Health Sciences at Columbia University's Mailman School of Public Health invites applications for 1-3 non-tenure-track faculty positions and 1-3 tenure track faculty positions in research areas including climate and health science.
Funding Opportunities
NIH’s Health and Extreme Weather (HEW) initiative is pleased to announce three new funding opportunities related to training and education. All three are R25 “education program” announcements. Under NIH’s new preferred funding structure, the HEW initiative and its participating Institutes, Centers, and Offices may consider R25 applications that fall within the scope of the HEW Highlighted Topic published in May. That Highlighted Topic states:
“Methods to advance the aggregation, linking, accessibility, and interpretation of health and weather-related data are also of interest, as are efforts to provide training and build the capacity of researchers across the disciplines needed to address the health impacts of extreme weather. Community engagement, interdisciplinary collaboration, and research translation are encouraged in health and extreme weather research applications.”
The three R25 funding opportunities are listed below. Please reach out to the Scientific Contact on the Highlighted Topic if you are interested in applying and any have questions.
- NIH Research Education Program - Research Experiences (Parent R25 - Clinical Trial Not Allowed) PA-27-036
- NIH Research Educational Program - Mentoring Activities & Networks (Parent R25/UE5 - Clinical Trial Not Allowed) PA-27-035
- NIH Research Education Program - Courses, Curriculum and Methods (Parent R25 - Clinical Trial Not Allowed) PA-27-034
Purpose of these announcements: “The National Institutes of Health (NIH) Research Education Program supports research education activities in the mission areas of the NIH. The overarching goal of the Research Education program is to: Support educational activities that complement and/or enhance training of a workforce to meet the nation's biomedical, behavioral and clinical research needs; Help recruit individuals with specific specialty or disciplinary backgrounds to research careers in biomedical, behavioral and clinical sciences; and Foster a better understanding of biomedical, behavioral and clinical research and its implications.”
In case you missed it, here is the June 3 roundup of job openings and funding opportunities.
If you have an opportunity you’d like to share with the CAFE community, please send it to cafecomms@hsph.harvard.edu.
Jobs and Funding Opportunities — June 3, 2026
In this ongoing series, we spotlight current job openings and funding calls in health and extreme weather research, plus related areas. Twice a month, we’ll round up timely positions, grants, and fellowships to help you find the right next step for your work.
Have an opportunity you’d like us to include in a future post? Please share it with us at cafecomms@hsph.harvard.edu.
Job Opportunities
- The World Health Organization seeks a consultant on climate, health, economics, and epidemiology to support the advancement of climate-health economic methods and evidence. Apply by June 15.
- The University of Washington Center for Health and the Global Environment seeks a postdoctoral fellow to support the adaptation work group of the Lancet Countdown on Health and Climate Change and develop metrics related to climate and health adaptation in the U.S.
- The Department of Environmental Health Sciences at Columbia University's Mailman School of Public Health invites applications for 1-3 non-tenure-track faculty positions and 1-3 tenure track faculty positions in research areas including climate and health science.
In case you missed it, here is the May 20 roundup of job openings and funding opportunities.
Jobs and Funding Opportunities — May 20, 2026
We’re thrilled to introduce a new series of posts that share job openings and funding calls in health and extreme weather research, and related fields. We will typically post twice a month, and each post will highlight timely positions, grants, and fellowships so you can explore what’s next for your work.
If you know of an opportunity we should feature, we’d love to hear from you at cafecomms@hsph.harvard.edu.
Fellowships for Graduate Students
- NASA is inviting applications for its FINESST program, supporting graduate student–led research projects in Earth and space science aligned with NASA’s science and exploration goals. Submissions due July 14.
- NOAA is inviting applications for the Sea Grant Knauss Fellowship, which offers graduate students a one-year opportunity in the Washington, D.C. area to contribute to real-world policy and public service work connected to coastal, marine and Great Lakes issues. Apply by June 3.
Job Opportunities
- The (Massachusetts) Governor’s Office of Climate Innovation and Resilience is hiring a Massachusetts Heat Resilience Officer to advance all-of-government actions that address the impacts of increasing temperatures and extreme heat. Submit questions, cover letter, and resume to Rose Skylstad.
- The Gangarosa Department of Environmental Health at Emory University is seeking a postdoctoral researcher to work on exposure assessment research.
- The Harvard Chan School Department of Biostatistics is hiring a postdoctoral researcher in data science/ML to assess the societal impacts of AI data centers. This position will focus on building a decision framework to guide the expansion of AI data centers, aligning economic opportunity with social impact.
- The Harvard Chan School Department of Biostatistics is hiring a postdoctoral research position to help develop next-generation AI methods for healthy climate adaptation.
- The Harvard Chan School Department of Biostatistics is hiring a postdoctoral research position to develop and apply novel causal inference methods for large-scale observational studies, with a particular emphasis on environmental exposures and public health.
- The Harvard Graduate School of Design's Center for Green Buildings and Cities is hiring a postdoctoral research fellow to develop scalable, data-informed solutions in sustainable design, construction, and energy management.
NIH Highlighted Topics
When beginning your next investigator-initiated application, consider the following NIH Highlighted Topic—Health and Extreme Weather: Advancing Critical Research to Address the Direct and Indirect Health Impacts of Weather-Related Natural Disasters and Emerging Weather-Related Harms.
Thirteen NIH institutes, centers, and offices have signed onto this Highlighted Topic signaling their interest in applications studying the health effects of extreme weather.
Learn more about the Health and Extreme Weather Highlighted Topic
Learn how to interpret and use Highlighted Topics
Recap: Examining the Intersection Between Infectious Disease and Extreme Weather
Thank you to all who joined us for the Examining the Intersection Between Infectious Disease and Extreme Weather half-day online event on March 31, 2026! If you missed it, or want to revisit key moments, here’s a recap:
Infectious Disease & Extreme Weather Expert Panel:
- Kacey Ernst (University of Arizona): highlighted how extreme weather shifts disease transmission and flagging that resilience strategies like urban greening can expand mosquito habitats, highligthing the need to evaluate system impacts.
- Quinn Adams (University of Colorado Boulder): shared predictive models for vector-borne diseases, showing how weather data can give months of early warning for outbreaks like leishmaniasis and West Nile virus.
- Jeffery Shaman (Columbia University): emphasized that weather‑related health research must span from molecular to geopolitical scales and stressed the importance of strong partnerships with public health agencies.
- Alexander Travis (Cornell University): highlighted the benefits of a One Health approach, linking wildlife ecology, veterinary medicine, and epidemiology using bat spillover and tick-borne disease research as examples of prevention-focused strategies.
Infectious Disease & Extreme Weather Lightning Talks:
Our six lightning talk speakers delivered fast-paced, impactful presentations on critical topics including:
- Mapping Heat Impacts on Childhood Sepsis in Bangladesh, Monira Armin, International Centre for Diarrhoeal Disease Research, Bangladesh (icddr,b)
- Modeling How Weather Drives Enteric Disease Risk in Maryland, Huimin Zhang, Morgan State University
- The Planetary Child Health & Enterics Observatory (Plan-EO), Josh Colston, University of Virginia
- Tropical Cyclones and Malaria Epidemiology in Madagascar, Benjamin Rice, Princeton University
- Modeling the Impact of Weather Extremes on Influenza Epidemics, Aleksandra Stamper, Brown University
- A Scalable Community-Driven Blueprint for Protecting Health, Basheer Waziri, Climate Resilience Action Group
Watch all lightening talks now
Workshop:
The workshop showcased the Johns Hopkins Center for Outbreak Response Innovation (CORI)’s work integrating public health messaging into weather broadcasts. Led by Dr. Eric Toner and Dr. Sutyajeet Soneja, the CDC-funded initiative delivered clear, actionable health information on seasonal infectious diseases and weather-related health risks through local meteorologists using infographics and brief talking points. The presentation also highlighted CORI’s broader efforts with health departments, including scenario-based risk assessments and outbreak preparedness projects, demonstrating how these approaches strengthened public awareness, improved risk communication, and supported proactive health responses.
Recap: CAFE University’s Pollution and Health—From Data to Evidence
Thank you to all who joined CAFE University’s Pollution and Health—From Data to Evidence webinar with Dr. Michael Cork, a postdoctoral research associate at the Harvard T.H. Chan School of Public Health! If you missed it, or want to review key points, here's a recap:
Why Exposure–Response Curves are Useful
Fine particulate matter (PM2.5) drives around 90% of the health burden from air pollution globally, and approximately 40% of Americans live in areas with unhealthy levels. In this presentation, “exposure” refers to something in the environment that people experience (e.g., air pollution); “outcome” is the health effect we measure in response to the exposure (e.g., hospital emissions); and exposure–response curves (ERCs) are a function that describes how the expected outcome changes as exposure varies, capturing the shape, magnitude, and direction of the relationship across the full exposure range.
ERCs can directly inform major policy benchmarks like the WHO’s Global Air Quality Guidelines and the U.S. National Ambient Air Quality Standards (NAAQS). Because the shape of an ERC informs where a safety threshold is set, using the correct methodology to model PM2.5 concentrations can lead to more accurate thresholds that better protect exposed populations.
Comparing Methods: Regression vs. Causal Inference
Much of the existing literature relies on regression-based approaches, which estimate the exposure–outcome relationship while adjusting for confounders as additional model terms. Dr. Cork's research evaluates these against causal inference methods, which add an explicit design phase to make observational data resemble a randomized experiment before analysis. Across a simulation study of 72 scenarios varying ERC shape, confounding complexity, and sample size, key findings included:
- In simple settings: Regression models performed well and were competitive with more complex approaches.
- In realistic settings: With nonlinear relationships and complex confounding, causal inference methods (particularly entropy balancing and GPS matching) outperformed regression.
- Sample size matters: Entropy balancing was most reliable at moderate sample sizes; generalized propensity score (GPS) matching performed best with larger datasets.
Real-World Example: PM2.5 and Medicare Mortality
In Dr. Cork’s paper, “Methods for estimating the exposure–response curve to inform the new safety standards for fine particulate matter”, he uses a causal inference approach, including GPS matching and entropy-based weighting, combined with flexible modeling of nonlinear exposure–response relationships. This methodology was applied to ~68 million Medicare beneficiaries across 31,000+ ZIP codes (2000–2016).
Using this framework, Dr. Cork identifies a nonlinear relationship between long-term PM2.5 and all-cause mortality, with the largest marginal increases in risk occurring at lower exposure levels. This risk gradient appeared well below the former NAAQS limit of 12 µg/m³, supporting the EPA's recent decision to tighten the standard to 9 µg/m³ and providing a case for continued reductions below the current standard. While this is just one example, it demonstrates how causal inference methods can be applied to develop a more accurate ERC, better informing policy makers and ultimately protecting exposed populations.
Data Needs for Accelerating Health and Extreme Weather Research
In this paper in published in Environmental Research: Health we surveyed researchers working at the intersection of extreme weather and health to identify major barriers to using and sharing data and code resources. We also asked about their most desired data or educational resources.
The most desired resources were analysis-ready datasets and educational materials on data management and analysis. Personal constraints such as lack of time were a major barrier to sharing data or code.
The survey results suggest that if we collectively invest in the expansion of data creation as a professional service, stronger knowledge sharing and collaboration, and improved research infrastructure, shared data resources will be enthusiastically adopted by researchers in this field to help to accelerate the pace of research to practice.
The survey instrument we used, as well as the de-identified survey results, can be found on the CAFE Dataverse.
Recap: Spatial Confounding and Interference in Environmental Health Studies
Thank you to all who joined CAFE’s Spatial Confounding and Interference in Environmental Health Studies webinar with Sophie Woodward and Salvador Balkus, fourth-year PhD students in Biostatistics at Harvard T.H. Chan School of Public Health.
This webinar discussed two methodological challenges in environmental epidemiology: spatial confounding and interference. If left unaddressed, spatial confounding and interference can bias effect estimates and lead to invalid confidence intervals. Drawing on recent work, the session introduced easy-to-implement models for addressing these challenges and presented a case study demonstrating their application in practice.
Why your data might reflect bias
Tobler’s First Law of Geography states that “Everything is related to everything else, but near things are more related than distant things.” Variables like air pollution, greenspace, and socioeconomic conditions are not scattered randomly across a map, they are clustered in space. This clustering can have consequences for spatial environmental health research.
If unmeasured confounders in your study are spatially patterned, that structure can bias your estimates in ways standard regression models won’t account for. Additionally, if outcomes in one geographic unit are shaped by what’s happening in neighboring units, this bias can be also be missed in standard regression models. These are the two problems this webinar aimed to tackle: spatial confounding and spatial interference.
Spatial Confounding
Using a California air pollution dataset, Woodward demonstrated how bias from unmeasured confounders—variables that are correlated with both exposure and outcome—can be mitigated if the unmeasured confounder exhibits spatial structure. . At its core, if a missing confounder varies smoothly across space, spatial methods can use geographic information to partially account for it. Woodward introduced a spatial method using a thin plate regression spline of latitude and longitude, to adjust for this confounding. To test how robust your estimates are to potential unmeasured spatial confounders, Woodward suggested running the spatial method as a sensitivity analysis alongside your main model.
Spatial Interference
Balkus tackled a related distinct problem: What if a unit’s outcome is affected not just by its own exposure, but by neighboring unit’s exposures too? Using commuting patterns as an example he showed how ignoring this network structure biases estimates.
To address this issue, Balkus used an exposure mapping, which is a weighted summary of neighbor's exposures included as an additional variable in a model. Balkus walked through a four-step linear model procedure using Census Bureau commuting data that recovered the true effect where a standard model did not. Importantly, accounting for interference can reduce variance by explaining more of the outcome.
Related Links:
Call For GeoCAFE Scholars Applications
Deadline to apply for the 2026 cohort is February 9.
Applications are now open for the 2026 GeoCAFE Scholars Cohort, an initiative funded by the U.S. National Science Foundation and designed to bridge the gap between experts in the geosciences and health sciences.
As we recruit members of our third cohort, we are looking for U.S.-based academic researchers at any career stage who are eager to accelerate science at the intersection of health and extreme weather.
If you are ready to expand your research horizons and forge impactful new partnerships, we invite you to apply today!
Learn more and apply now
Celebrating 1,000 Datasets: The CAFE Dataverse Community Hits a Milestone!
Researchers from around the world have now contributed over 1,000 datasets to CAFE’s collection on Harvard Dataverse, an open-source repository where you can find or share data key to health and extreme weather research.
This milestone is a community-wide achievement. When CAFE launched its Harvard Dataverse collection three years ago, the goal was simple but ambitious: Create a trusted home where researchers could share, preserve, and discover data following FAIR (Findable, Accessible, Interoperable, Reusable) principles that comply with NIH data sharing guidelines. The response has far exceeded what CAFE’s Data Management team imagined, with over 1000 authors from over 100 institutions contributing data from more than 100 countries to the collection. To date, more than 500 datasets have been downloaded, and harvested datasets have been accessed nearly 6,700 times.
“The level of acceptance the research community has made in making CAFE a home for sharing data goes beyond us,” reflects Kevin Lane, Co-Lead of the Data Management Function. “Researchers are talking about it with each other and reaching out to share their data. It’s extraordinary to see. I don’t think when we started this project we thought it would be this successful this quickly. We are grateful for the community’s great contributions.”
Reaching 1,000 datasets means that researchers now have access to data that spans exposure assessment, extreme weather, air quality, health outcomes, environmental health indicators, and more. Access to high-quality, well-documented data is essential for researchers, policymakers, and communities to understand risks and implement solutions.
Partnerships Power the Platform
Reaching 1,000 datasets was made possible by a wide range of contributions, from individual investigators, to new subcollections submitted by the community, to collaborative efforts to bring large existing collections into CAFE’s Dataverse.
For example, CAFE partnered with the Center for International Earth Science Information Network (CIESIN) at Columbia University to migrate NASA’s Socioeconomic Data and Applications Center (SEDAC) datasets into a CIESIN subcollection within CAFE. Together, the teams worked to preserve long-term access to more than 300 SEDAC datasets spanning gridded population, environmental, and socioeconomic data.
CAFE’s collaboration with DesignSafe followed a similar path, but through harvesting rather than migration. The DesignSafe subcollection in CAFE Dataverse lists and describes datasets that are published in the DesignSafe Data Depot Repository, the open-access repository of the National Science Foundation-supported Natural Hazards Engineering Research Infrastructure. DesignSafe datasets were gathered during experiments, simulations, field reconnaissance missions, surveys, and other activities that study the impact of natural hazards on people and structures. By coordinating metadata and descriptions between teams, researchers can now find natural hazards datasets in the same place they already look for extreme weather, exposure, and health data.
Behind the Scenes
This work would not have been possible without the Harvard Dataverse team, whose partnership and technical expertise have been central to CAFE’s success from the beginning.
“The inherent knowledge of building something like this is eye opening,” Lane notes. “You see how much work goes into mechanisms like metadata, and how to harmonize and link with other highly curated datasets and our own.”
Together, the CAFE and Harvard Dataverse teams have focused on a single priority: making it straightforward for researchers to share their data. Over nearly three years, they’ve defined what belongs in the CAFE collection, specified metadata that should always accompany a dataset, and refined templates and workflows so contributing data is smooth and easy. As the collection and community have grown, the same approach has been extended to support subcollections and harvested datasets, allowing individual investigators, large collaborations, and partner repositories to participate in ways that are consistent and manageable.
The result is that researchers with valuable data now have a trusted home for sharing it, and others know they can find the data resources they need to advance their own research.
Get Involved
We invite you to be part of what comes after 1,000.
- Explore the CAFE Collection on the Harvard Dataverse, which follows FAIR principles and adheres to NIH guidelines for data sharing.
- Help expand the collection by contributing data for sharing, and help us increase discoverability by following our updated guidelines on the metadata we collect.
- Browse our GitHub repository for code, tutorials, and tips on handling common data formats and sources, and check out our Getting Started with GitHub guide.
- Spread the word: Share the collection with collaborators, students, and partners who may be looking for data, or a home for their own research data.
Together, we can keep building a shared resource that makes it easier to do rigorous, reusable, and impactful research.
Recap: Considerations for Temperature in Public Health Studies
Thank you to all who joined CAFE's Considerations for Temperature in Public Health Studies webinar with Lauren Mock and Shreya Nalluri from the Harvard T.H. Chan School of Public Health.
This webinar focused on how to study the effects of temperature on health. Attendees learned how to define a temperature exposure, choose an appropriate temperature dataset, and what to consider when modeling the relationship between temperature and health outcomes. This webinar is designed for those with some background in epidemiology who are relatively new to working with temperature exposures.
If you missed it, or want to review key points, here's a recap of the data resources they presented.
Why Temperature Matters for Public Health Research
Mock and Nalluri began by highlighting the increased recognition of extreme temperature events as major public health risks. Mock introduced the potential short-term health impacts of extreme temperature exposure. Stressing that accurately assessing these impacts requires careful consideration of how we define, measure, and link temperature exposures to health outcomes.
Key Temperature Data Sources
- ERA5: Global hourly data available at 9 x 9 km resolution (land only) or 31 x 31 km resolution (land and ocean), spanning from 1940/1950 to present. Provides over 200 climate variables as well as wet bulb globe temperature (WBGT) and universal thermal comfort index (UTCI).
- GridMET: Daily data at 4 x 4 km resolution for the contiguous U.S., available from 1979 to present. Combines PRISM and NLDAS2 data to create spatially and temporally complete estimates.
- PRISM: Daily and monthly data for the contiguous US at either 800 x 800 meter or 4 x 4 km resolution. Daily data extends from 1981 to present, while monthly data begins in 1895.
CAFE Resources Available Now
The CAFE team has also developed several resources to support temperature-health research:
- GitHub tutorials on querying ERA5 data, deriving heat metrics, performing spatial aggregations and population weighting.
- Harvard Dataverse deposits with pre-processed, spatially-aggregated temperature data.
- County and zip code aggregated US GridMET variables.
- Multi-source meteorological data providing spatially aggregated monthly and annual data from multiple datasets.
Key Takeaways
Mock and Nalluri stressed several important considerations for temperature in public health research:
- Higher spatial resolution comes with computational trade-offs and may not always capture microscale health effects like urban heat islands.
- Researchers must carefully consider which health metric best captures the physiological effects relevant to their research question.
- Case-crossover designs and distributed lag nonlinear models (DLNMs) as particularly useful analytical approaches that can account for individual-level confounding and capture non linear temperature-health relationships over time.
As Nalluri noted, the goal is to transform temperature data “into something that can be more physiologically relevant and more useful for health outcomes research.”
Pilot Project Spotlight: Daily Pollen Level Variations in Montreal, Canada
Principle Investigator: Dr. Scott Weichenthal, McGill University
As the CAFE 2024 Pilot Program passes the one-year mark, we’re thrilled to take a moment to spotlight the great work coming out of this initiative. This blog series will offer pilot awardees the opportunity to share their research with the CAFE community, highlighting what they’ve been working on, and what they’ve accomplished since receiving funding. Our first pilot highlight is Dr. Scott Weichenthal’s research, which aimed to examine daily pollen levels in Montreal, Canada.
What problem is this project trying to solve?
Pollen seasons are becoming longer and more intense, worsening symptoms for people with asthma, COPD, and other respiratory issues. Emerging evidence, including some of Dr. Weichenthal’s previous work, also links higher daily pollen levels to an increased risk of heart attacks.
Being able to predict when and where pollen levels will be highest can help people and health systems better prepare, reduce exposure, and prevent serious health problems. However, because there’s limited infrastructure to collect detailed pollen data within cities and over time, we don’t yet have a complete picture of how everyday urban pollen exposure affects the risk of cardiovascular disease.
How does this project address the problem?
This pilot study collected data across Montreal, Canada, to build a model that can predict how daily pollen concentrations change daily throughout different parts of the city.
The team generated 200 random sampling locations across Montreal. Students visited these sites daily to collect samples, which were then shipped to the laboratory for analysis. Results indicated that approximately 100 distinct types of pollen spores were identified at each site. Once fully analyzed, this data will form a comprehensive database capable of predicting how pollen and spore concentrations vary within Montreal daily throughout the pollen season.
Where does the project stand now?
The team has completed data collection for the pilot study and has begun conducting descriptive analyses and developing preliminary models. Notably, due to the acquisition of additional funding, the team will integrate the pilot data into a larger dataset as part of the expanded study.
What’s the future of this research?
The research team conducted the CAFE-funded pilot in Montreal, and was able to use the resulting data to secure a larger grant. The team is now planning to implement this expanded project across Toronto and Ottawa, using the same approach, with the goal of creating a more comprehensive exposure database. Research teams in all three cities will deploy students to conduct daily sampling throughout each city.
How did CAFE pilot funding help this project?
“The CAFE pilot funding was instrumental in launching this project,” said Dr. Weichenthal. “It allowed me to bring together a small team to conduct field work, and it supported an extended data-collection period. Having that initial data strengthened our subsequent grant application.”
As this work expands to Toronto and Ottawa, the project demonstrates how targeted pilot funding can catalyze larger research efforts. Through CAFEs funding this research was able to lay the groundwork for a larger project that will now generate comprehensive data that can inform and help create a healthier urban environment.
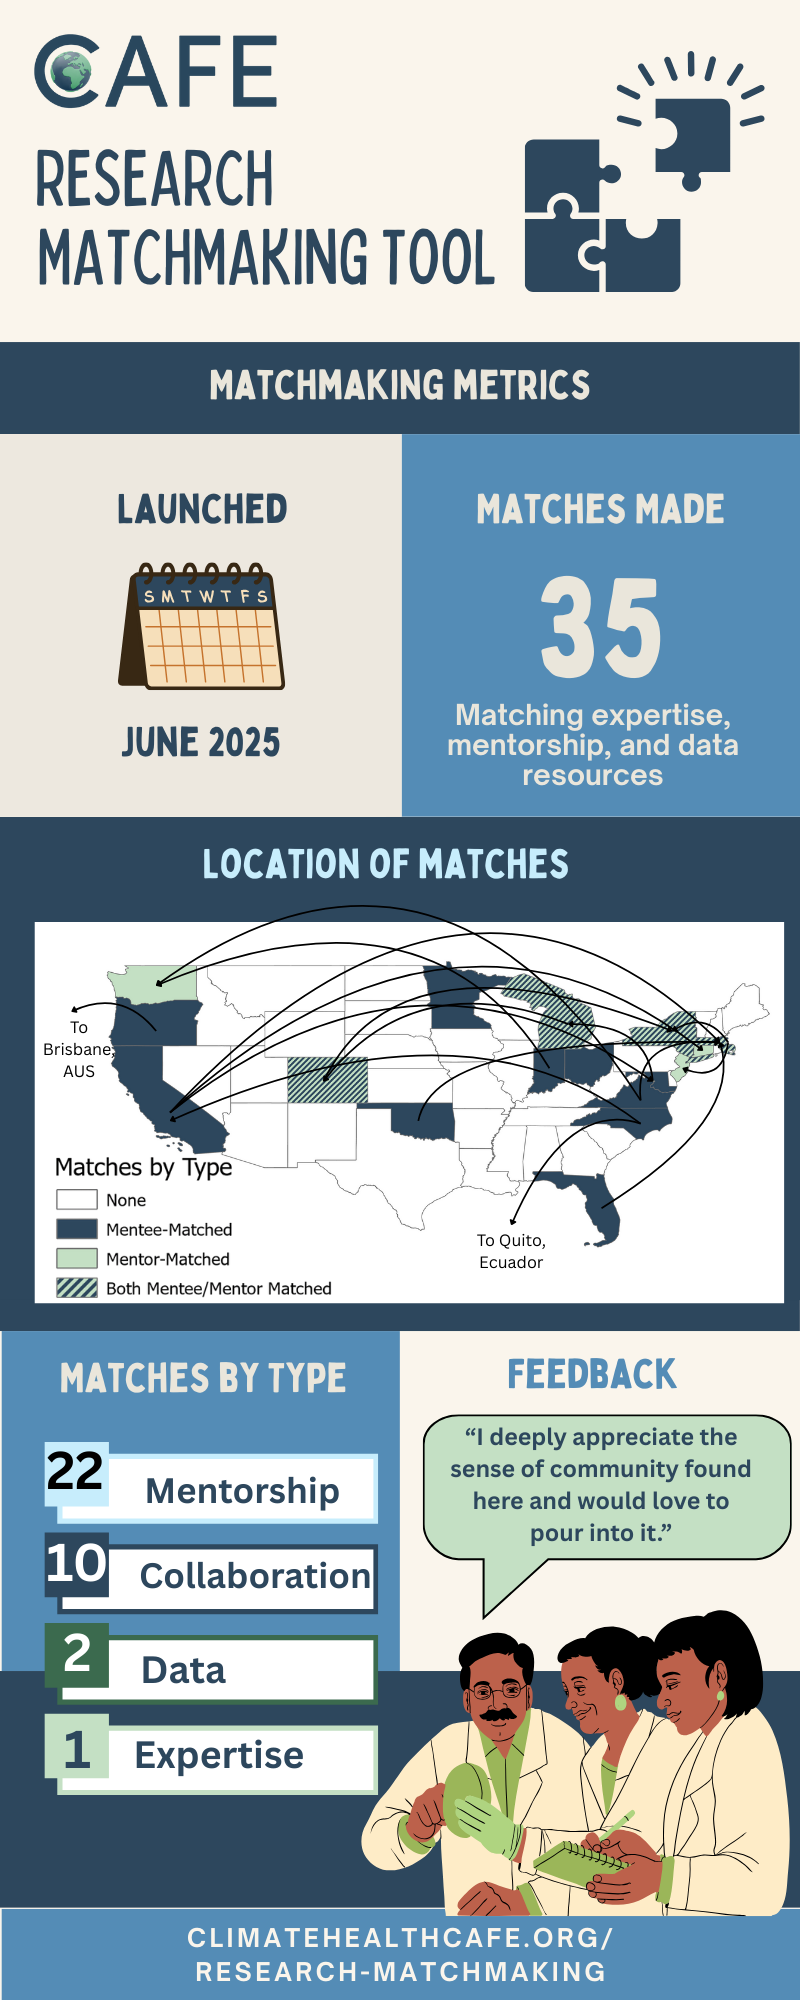
2025 Matchmaking Metrics
We launched our research matchmaking tool in June 2025 to help you connect with fellow members of the climate and health community.
Six months later, we’re excited to look back at what we’ve achieved together so far. Thank you to everyone who has reached out to share your needs and help build these connections.
Below, you’ll find an infographic highlighting key metrics from our matchmaking program. If you’re looking for a collaborator, a mentor, data, or specific expertise, fill out the matchmaking form and we’ll be in touch when we find you a match!
Recap: Wildfires & Health From Research to Resilience
Thank you to all who joined us for the Wildfires and Health: From Research to Resilience online conference on November 19, 2025! If you missed it, or want to revisit key moments, here’s a recap:
Wildfires & Health Expert Panel:
- Minghao Qiu from Stony Brook University opened with an overview of wildfire and health research, and discussed key trends and projections.
- Mary Margaret Johnson from Harvard University discussed the ongoing work of the LA Fire Health Study, including exposures measured, current tools used, and how they engage with community and government officials.
- Jennifer Stowell from the University of Maryland discussed the use of prescribed burning techniques to mitigate wildfire severity and associated health effects.
- Sarah Henderson from the University of British Columbia spoke about the impacts wildfires have on communities and practical solutions that can be implemented to mitigate exposure risks.
Wildfires & Health Lightning Talks:
Our eleven lightning talk speakers delivered fast-paced, impactful presentations on critical topics including:
Topics Included:
- Wildfires and industrial chemicals: Amanda Hoffman-Hall, Eckard College
- Quantifying PM2.5 and O3: Dan Jaffe, University of Washington
- Chicago 2023 Wildfires, Mercedes Bravo, Duke University
- Air Quality Index effectiveness in conveying toxic metal exposures, Jo Kay Ghosh, Heluna Health
- Behavioral Health Support for Wildfire Firefighters, Sienna Mark, Northeastern University
- Land Management to Mitigate Future Wildfire Activity in California, Claire Bekker, University of California Los Angeles
- Health Impacts of Wildland-Urban Interface (WUI) Fires, Kelly Perry, Duke University
- Wildfire Birth Outcomes in California, Lanxin Song, University of California Los Angeles
- Social Support Networks of Rural Older Adults, Kelly Szott, Southern Oregon University
- Wildfire Smoke Exposure among People who are Incarcerated, Kristen Cowan, University of Buffalo
- Stroke Incidence and Long Term Exposure to PM2.5, Yang Liu, Emory University
Watch the Full Session Here:
Workshop:
The Public Health Extreme Events Research Network (PHEER) and the Natural Hazards Engineering Research Infrastructure RAPID facility, collected critical post-disaster data following the January 2025 Los Angeles wildfires. The team captured high-resolution aerial imagery, 3D point cloud models, and street-view documentation across 30 km² of fire-affected areas in the Pacific Palisades and Altadena communities before debris removal. PHEER partnered with the NHERI Rapid Facility to conduct hyperspectral imaging of 25 fire-affected census blocks in the Pacific Palisades and Altadena communities in California. Ongoing analyses are underway to quantify toxins in soil, debris, water, and air, and later to incorporate into dose-response health outcome studies.
Watch the Workshop / Access PHEER Wildfire Exposure Map
Recap: CAFE University’s Introduction to Synthetic Health Data
Thank you to all who joined CAFE University’s: Introduction to Synthetic Health Data webinar with Sherya Nalluri, a CAFE Data Management Team Member and a programmer at the Harvard T.H. Chan School of Public Health! If you missed it, or would like to review key points, here’s a recap, with links to relevant moments in the recording.
The Challenge of Real-World Health Data
Real-world health data is ideal for analyzing trends, guiding public health strategies, and reducing care disparities. However, working with it comes with significant challenges. Strict privacy regulations create high barriers to data access, often requiring Institutional Review Board approvals and data use agreements. This high burden of acquiring access to data can significantly slow research.
What is Synthetic Health Data?
Synthetic data offers a solution to many of these challenges. Created using generative AI techniques, synthetic data mirrors the features and patterns of real-world health information while protecting patient privacy.
Using synthetic data is beneficial as it can reduce time and cost for data access, simplify the regulatory process, and allow for sharing data and code more openly. This can enable more reproducible research and expand collaboration across institutions.
Types of Synthetic Health Data:
- Fully Synthetic: Generated entirely by a model with no real-world data.
- Partially Synthetic: Real data with sensitive data replaced.
- Hybrid Synthetic: Blend of real and synthetic data.
Three Major Synthetic Health Data Resources:
- The CMS Data Entrepreneurs Synthetic Public Use File (DE-SynPUF): Provides fully synthetic Medicare claims data covering 2008-2010. While not suitable for inferential research, it is useful for software development and training researchers on the complexity of claims data.
- Synthetic Mass: Developed by the open-source platform Synthea, this dataset offers fully synthetic electronic health records for one million synthetic Massachusetts residents from 2019-2022. It includes 18 different files covering patient demographics, clinical encounters, diagnoses, prescriptions, and provider information.
- The AHRQ Synthetic Health Database: A partially synthetic resource covering all Medicare, Medicaid, and commercial insurance payers for 2016.
Key Takeaways:
Sherya emphasized that:
- While synthetic health data offers tremendous opportunities, important caveats remain. Bias could exist in the source data and it could be replicated or even amplified in the synthetic data sets, potentially perpetuating health inequalities.
- Synthetic data isn’t a replacement for real-world data, but rather a complementary tool that expands research possibilities while maintaining privacy protections. As NIH data sharing requirements expand, these resources will play a growing role in enabling researchers to develop methods, train students, and facilitate collaboration in extreme weather and health research.
Recap: CAFE’s State of the Science Webinar on AI and Data Science
Thank you to all who joined CAFE’s State of the Science: AI and Data Science - Beyond the Buzzwords webinar with Dr. Marianthi Anna Kioumourtzoglou from Brown University and Dr. Joan Casey from the University of Washington! If you missed it, or want to review key points, here’s a recap, with links to the relevant moments in the recording.
How Researchers Are Currently Using AI
Dr. Casey outlined practical ways environmental health researchers are engaging with generative AI tools:
- Coding assistance
- Assisting in literature review searches
- Editing text for manuscripts/proposals
- Generating graphs for presentations
The shift to using AI has been dramatic. Stack Exchange, once the go-to resource for coding help, has seen a 75% drop in traffic since 2017 as researchers have begun to turn to AI tools instead.
Concerns
Electricity Consumption: Data centers now consume approximately 4% of U.S. electricity, projected to reach 6.5% - 12.5% by 2028. About 56% of this electricity comes from fossil fuels, and communities near data centers are paying 100 - 200% more for electricity compared to 5 years ago.
Water Consumption: Data centers are water-reliant. Microsoft saw a 34% increase in water consumption from 2022 to 2023, with AI estimated to use more water annually than the country of Denmark by 2027.
Algorithmic Bias: AI that is trained on biased or incomplete data will reproduce and amplify those same inequalities in its results. If some communities are underrepresented in the training data, AI models may produce findings that favor well-represented groups while misrepresenting marginalized populations.
Overconfidence in Wrong Results: AI can generate code that runs and produces results but is methodologically wrong. As Dr. Kioumourtzoglou noted, students may receive statistically wrong answers without recognizing the error, which is a risk for those without strong methodological training.
Key Takeaway
Dr. Kioumourtzoglou and Dr. Casey noted that AI can complement but not replace rigorous epidemiological training. While these tools offer tremendous potential for handling complex environmental health data, researchers must maintain critical thinking and push for regulations addressing AI’s environmental impacts.
Recap: CAFE's State of the Science Webinar on Greenspace and Health
Thank you to all who joined CAFE’s State of the Science: Greenspace and Health webinar with Dr. Peter James from UC Davis! If you missed it, or want to review key points, here's a recap, with links to the relevant moments in the recording.
The Growing Evidence Base
Dr. James presented on the expanding body of research that shows measures of greenspace are associated with many health benefits. Several studies have found that people living in the greenest areas experience an approximately 12% lower mortality rate compared to those in the least green areas. A 2019 study of the Danish population found that children who grew up with the lowest levels of green space had up to 55% higher risk of developing a psychiatric disorder.
New Tools to Measure Types of Greenspace
Much of the literature to date has relied on satellite-based vegetation indices like the Normalized Difference Vegetation Index (NDVI) to assess greenspace. However, NDVI is a marker of vegetation and doesn’t distinguish between different types of greenspace or the quality or accessibility of that space. Dr. James’ team is instead applying novel deep learning algorithms to differentiate between trees, grass, and other vegetation types. This allows their studies to determine the potentially different health impacts of varying mixes of vegetation.
Health Impacts
- Mental Health: Evidence has shown that residential green space exposure is associated with lower levels of depression, anxiety, and stress.
- Healthy Behaviors: Evidence suggests that living in greener neighborhoods is associated with better sleep quality and higher levels of physical activity.
- Chronic Diseases: Higher greenspace exposure has been linked to lower incidence of cardiovascular disease, diabetes, and may be associated with a lower risk of Alzheimer’s disease.
- Birth Outcomes: Consistent evidence suggests a positive relationship between greenspace exposure and birth weight.
Key Takeaways
Dr. James emphasized greenspace represents a crucial component of healthy community design. Current research priorities include developing better measures of actual contact with nature using GPS and wearable sensors, understanding the specific elements in nature that drive health benefits, and exploiting natural experiments such as tree planting interventions in at-risk communities. “We need to make [greenspace] not a perk that only the wealthy can have, but something that we see as a core part of our infrastructure,” Dr. James noted.
What can CAFE do for you?
No matter your experience level, research interest, or sector, the Research Coordinating Center for Climate and Health (CAFE RCC), has something for you.
From tools and tutorials to webinars, conferences, and specialized programs, CAFE offers resources designed to advance your research. We’ve created this guide to help you discover the support and opportunities that best support your needs.
Join CAFE’s Community of Practice
- CAFE is a community of people committed to collaboration and peer support. Join CAFE’s Community of Practice to connect with others working in the field of extreme weather and health. All members recieve CAFE’s twice-monthly newsletter to stay informed about events, tools, and matchmaking opportunities.
- Connect with us on LinkedIn, Slack, and BlueSky.
- Stay up to date on upcoming CAFE events, as well as events within our community, on the CAFE Website.
Find the data you need (and share data you’ve collected)
- Explore the CAFE Collection on the Harvard Dataverse, an open-source repository where you can find or share data key to environmental health research, now with over 1000 datasets and counting.
- Help us expand our collection by contributing data for sharing, and help us increase discoverability by following our updated guidelines on the metadata we collect.
- Explore SEDAC Datasets: Access essential population, environmental, and socioeconomic data from the NASA Socioeconomic Data and Applications Center (SEDAC). In September 2025, all 300 existing SEDAC datasets began a migration to CAFE’s Data Collection on Harvard Dataverse, with plans to expand the collection with new datasets on a rolling basis.
- Submit a request to our Research Matchmaking Tool if you need help finding a dataset for your research.
Translate your data into insight with CAFE’s coding resources
- Access our GitHub Repository for reproducible code, models, and training materials shared by the CAFE team.
- Find coding tools on CAFE’s Educational Resource Hub. Select the resource type “Code Repository” and add your own via the form at the bottom of the page.
- Search for webinars and tutorials on spatial analysis and coding tips on our Educational Resource Hub and our YouTube Channel.
Sharpen your skill set with CAFE’s education offerings
Webinars
- CAFE’s State of the Science Webinar Series features speakers from across disciplines who provide a primer on what's known about the health impacts of disasters. Past topics include greenspace, droughts, aging, and more.
- The CAFE University Webinar Series offers training opportunities ranging from processing weather data to incorporating implementation science into extreme weather and health research. Find the archive in the Educational Resource Hub or on YouTube.
Virtual Conferences
- Take a deep dive into extreme weather and health research with CAFE’s virtual conferences. Each half-day event includes expert panels with leading professionals, lighting talks exploring emerging research, networking, and workshops. The inaguaral conference explored Hurricanes and Health, the next will explore Wildfires and Heatlh, with more topics coming soon.
Educational Resources and Mentorship
- Our CAFE Educational Resource Hub is a community-driven directory linking you to education materials. You can browse and add resources spanning data analysis, geospatial tools, science communication, grant writing, and more.
- Find a mentor by submitting a request to our Research Matchmaking Tool to be connected with a mentor based on your research interests.
From NASA to Dataverse: Preserving Access to Crucial Remote Sensing, Environment, and Population Data
For more than 25 years, researchers across disciplines and policymakers worldwide have relied on the NASA Socioeconomic Data and Applications Center (SEDAC) to provide essential open-access population, environmental, and socioeconomic data. The spatial data produced or curated by SEDAC were specifically intended to facilitate integration with gridded Earth science data, in particular data from NASA’s constellation of remote sensing instruments. SEDAC has been managed by the Center for Integrated Earth Science Information (CIESIN) at Columbia University since 1998.
Today, we are excited to announce a new chapter for this invaluable resource: the transition and expansion of the CIESIN data collection, which will now be hosted as part of CAFE RCC’s Data Collection on the Harvard Dataverse Repository. This transition ensures more sustainable, long-term preservation of data while broadening access for researchers, policymakers, and practitioners across disciplines.
The Harvard Dataverse is a generalist repository that adheres to the FAIR Principles, is open-source, and enables anyone to both deposit and download data. It is free and open to anyone from any discipline, and anyone can share, archive, cite, access, and explore data.
What’s Changing and What’s Not?
The complete collection of 300 existing SEDAC datasets are migrating to the Harvard Dataverse repository for wider and more sustainable access. All SEDAC data will be available as a clearly labeled subcollection within the CIESIN collection on Harvard Dataverse. CIESIN is also releasing new data into this CIESIN dataverse collection. For example, the Global Gridded Relative Deprivation Index (GRDI v1.10) and EnvClim grids of urban exposure to climate risks have already come online, and over the coming weeks and months you’ll see other datasets being added to these.
According to CIESIN director, Dr. Alex de Sherbinin, “The CIESIN collection is of great value to those who are seeking to understand current extreme weather risks, such as extreme heat and sea level rise, among highly exposed populations. It also includes projections of population and urban areas to better characterize future exposure. This makes it a perfect fit for the CAFE collection.”
Here’s a look at some of the datasets available on the CIESIN dataverse subcollection:
- Gridded Population of the World (GPW): Global population distribution by age and sex, this dataset has been the gold standard for environmental exposure analysis, disaster preparedness, and policy modeling since the 1990s. Versions 3 and 4 of this flagship data product are available for download in the SEDAC subcollection of the CIESIN collection on Dataverse, and version 5 is under development for future release on Dataverse.
- Air Pollution Metrics: Detailed local air quality data, originally developed by academic partners at Washington University in Saint Louis and Harvard University’s Chan School of Public Health, supports ongoing public health research and monitoring.
- Environmental Performance Index (EPI): Data and reports for every release of the Yale/Columbia EPI from 2006-2024, as well as its predecessor, the Environmental Sustainability Index (ESI).
- Global Urban Points and Polygon Dataset (GUPPD): Records on over 125,000 settlements worldwide, including names and population trends since the 1970s, this dataset supports urban planning and historical research.
These datasets, among many others, will be complemented by new datasets currently in the development pipeline (including, in some cases, updates to the datasets highlighted above). As datasets are completed, they will be deposited into the CIESIN subcollection on Dataverse.
What to Expect in the New Repository
You’ll notice the new repository looks and works a bit differently than what you might be used to. On NASA Earthdata Search, users can still access SEDAC data through a faceted search on variables, years, and regions. On Harvard Dataverse, under CIESIN’s subcollection within the CAFE collection, users will instead browse file lists and apply basic filters. The data are packaged in formats that make them easily downloadable for analysis.
To help you adjust, we’re developing support materials, including tutorials, FAQs, and guides, to make it easier for you to find and download exactly what you need from the new CIESIN subcollection on Harvard Dataverse.
Looking Ahead
The transition of CIESIN’s data to the CAFE’s Harvard repository collection marks a significant step forward in the long-term preservation of SEDAC’s socioeconomic and environmental data. These datasets are vital for research on population dynamics, environmental exposures, and health outcomes, offering high-value resources for both scientific and policy applications.
As we continue this transition, you can expect regular updates and new releases of both legacy and next-generation datasets. We’ll be sharing updates and showcasing data from CIESIN in CAFE’s newsletter, on CAFE’s social channels, and on the CAFE GitHub page.
Explore CIESIN’s Data Collection Now, and let us know what features or datasets are most useful for your work.
Photo: © ChrisTYCat - stock.adobe.com
Recap: CAFE's State of the Science Webinar on Droughts
Thank you to all who joined CAFE’s State of the Science: Droughts and Health webinar with Dr. Jesse Berman from the University of Minnesota! If you missed it, or want to revisit key points, here’s a recap, with links to the relevant moments in the recording.
The Hidden Crisis
Of everyone affected by natural disasters around the world, 35% are affected by droughts, yet this is an area that remains understudied. Dr. Berman noted that, unlike dramatic hurricanes or wildfires, droughts' gradual nature does not capture public attention despite its significant impact.
Research Challenge
Dr. Berman explained the complexity of studying this topic. Unlike direct exposures like heat or air pollution, droughts affect health indirectly through a series of secondary events, like increased dust, changes in the chemical composition of dust, or loss of economic stability, making it challenging to study.
Health Impacts
- Occupational Stress: Dr. Berman discussed his study of Midwestern farmers, drought conditions exacerbated stress 4x higher than other stressors, such as existing pain.
- Compound effects: Dr. Berman explored the compound effects that droughts can have on populations during heat wave events.
- Specific disease impacts: Dr. Berman covered the different drought conditions that enable diseases like West Nile and Lyme Disease to spread.
Key Takeaways
Unlike acute weather events, drought’s gradual nature allows time for interventions. “We can put policies into place before droughts become severe,” Dr. Berman emphasized.
Current research priorities include developing standardized metrics, better identifying at-risk populations, and developing early warning systems that help policymakers better prepare their communities for resilience.
Photo: © Rhett Ayers Butler - stock.adobe.com
Call for Applications: Storytelling and Narrative Workshop
Use the Power of Story to Strengthen The Impact of Your Work in Climate and Health
Stories have the power to inform, connect, and inspire, which is especially important for those working at the intersection of climate and health, where facts and data alone are not always enough.
CAFE’s Public Narrative Workshop, now in its second year, will introduce practical storytelling tools and techniques to help participants expand the reach and impact of their work. Participants will explore how to connect personal experience to broader themes, deepen understanding of shared challenges, and craft stories that communicate their work with clarity and purpose.
The workshop consists of four sessions on November 13, November 20, December 4, and December 11, from 9:00–11:00 a.m. ET.
Application deadline: September 12, 2025.
Recap: Hurricanes and Health: Understanding Risks and Fostering Resilience
Thank you to all who joined us for the Hurricanes and Health: Understanding Risks and Fostering Resilienceonline conference on August 4, 2025! If you missed it, or want to revist key moments, here’s a recap:
Hurricanes & Health Expert Panel
- Research update: Arbor Quist from Ohio State University opened with an overview of hurricanes and health research, and discussed key challenges and research gaps.
- Landfall frequency: Shaui Wang from the University of Delaware described the increasing frequency of hurricanes making landfall in the Atlantic basin due to shifting climate patterns.
- Emergency preparedness: Edwin Sumargo from the Massachusetts Executive Office of Energy and Environmental Affairs and Mike Souza from Massachusetts Emergency Management Agency shared how state level emergency management teams prepare and coordinate for hurricanes across sectors.
- Hurricane Forecasting: John Morales from NBC-6, South Florida spoke about evolving challenges in hurricane forecasting and the potential health implications for communities.
Hurricanes & Health Lighting Talks
Quick as a flash! 7-minute presentations to spark new ideas
Our seven lighting talk speakers delivered fast-paced, impactful talks covering hurricane effects on mortality, chronic conditions, birth outcomes, diarrheal diseases and older populations, as well as the implementation of resilient health care systems and spatiotemporal modeling to potentially decrease health impacts.
Speakers included:
- Arnab Gosh, Cornell University
- Jiahang He, Boston University
- Xuejuan Ning, Yale School of Public Health
- Szu Yu Lin, The University of Tokyo
- Michelle Evans, Pivot
- Elena Naumova, Tufts University
- Ryan Zomorrodi, University of Illinois Chicago
- Elizabeth Fussel, Brown University*
* We regret that we experienced technical difficulties and could not record Elizabeth Fussel’s presentation.
Workshop: Assessing hurricane exposure for epidemiological research
This workshop, led by Brooke Anderson from Colorado State University, covered how to assess hurricane wind exposure for epidemiological studies using storm tack data and wind field models. She introduced R packages “hurricaneexposure” and “hurricaneexposuredata”, which allow researchers to estimate local-level exposure to hurricanes. She took a deep dive into analytical methods for assessing hurricane exposure, using wind exposure over time in this example case with the R “hurricaneexposure” package.
Watch the workshop | Access the R Package
Stay tuned for future events like this!
Explore the CAFE Resource Hub
In the rapidly evolving field of climate and health, staying current with the latest tools and training is essential for impactful work. To support your efforts to navigate this landscape, we’ve launched the Educational Resource Hub, a comprehensive, crowd-sourced collection of educational resources curated by and for the community.
How It Works
Rather than hosting content directly, the Resource Hub serves as a centralized directory linking to existing educational materials. The platform operates on a community-driven model where users can both access and contribute resources, creating a continuously expanding collection tailored to the needs of climate and health professionals. The collection also hosts educational material created by the CAFE team.
The Hub was developed through collaboration between our Data Management and Capacity Building teams, with a focus on accessibility and practical utility.
Available Resource Categories
Resource Types:
- Books and reference texts on climate-health topics
- Code repositories with analysis and visualization tools
- Online courses covering technical and professional skills
- Step-by-step tutorials for data analysis methods
- Recorded webinars and instructional videos
Skill Areas Covered:
- Data analysis, visualization, and statistical methods
- Cloud computing and computational tools
- Geospatial analysis and mapping
- API integration and data access
- Grant writing and professional development
- Science communication and writing
Contributing to the Hub
The Hub's strength lies in its community contributions. If you've found or developed resources that have been particularly useful in your work, consider adding them to the collection.
To submit a resource, use the submission form at the bottom of the Hub's main page. We will review submissions for relevance and appropriateness, though users should evaluate resources based on their own needs and verify attribution requirements.
For those with datasets to share, we recommend using Harvard Dataverse, as the Hub only aggregates links to external content rather than hosting files.
Important Considerations
- The Hub links to external content only; no files are hosted locally.
- Resource quality is not verified by CAFÉ. Users should review individual resource terms and attribution requirements
- The collection expands continuously through community contributions; check back regularly for new materials.
Getting Started
The CAFÉ Educational Resource Hub is available now and currently hosts 129 resources. Whether you're looking for specific technical training or want to contribute resources you've found valuable, the platform is designed to make professional development more efficient for our community.
Welcome to the New CAFE Website!
We’ve redesigned our website to make it easier for you to find and access resources, opportunities, and connections to advance your climate and health research.
Take a tour:
Access Data Resources: Learn how to access and contribute to the CAFE Dataverse, an open-source repository where you can find or share data central to environmental health research.
Explore Resources: Visit our searchable community-sourced Educational Resource Hub. You can browse and share resources including data analysis, geospatial, science communication, and grant writing resources, and more.
Expand your network with CAFE connections: If you are looking for a collaborator, a mentor, data, or expertise in a specific area, check out our Matchmaking Tool.
Attend CAFE Events: Stay informed on event updates including workshops, webinars, and training opportunities. From GIS mapping workshops to state-of-the-science webinars, we're committed to building capacity across our community.
Explore Funding Opportunities: Get updates on all of our funding opportunities, including our pilot project programs, grant announcements, the GeoCAFE Scholars program, and other funding resources.
Our Commitment to Action
We redesigned this site to spark collaboration and drive research and practice in the field of climate and health. We hope we’ve made it easier for you to connect, collaborate, and create impact. You can help this effort grow by:
- Submitting a dataset to the CAFE Dataverse
- Adding resources to our Educational Resource Hub
- Letting us know about your new publications and upcoming events

Thank you for being part of our community, we hope you enjoy our site!


