Recap: Linking Greenness to Health: NDVI and EVI tutorial
Thank you to all who joined us for CAFE University’s Linking Greenness to Health: NDVI and EVI Tutorial. This webinar was presented by members of CAFE’s Data Management team, Allison James, MS and Kevin Lane, PhD, MA. Following Dr. Lane’s introduction to greenness, greenspace and health, Allison provided a technical walkthrough in accessing and utilizing satellite data.
For those who were unable to attend or would like a refresher, we have summarized the key takeaways below.
Greenness and Health
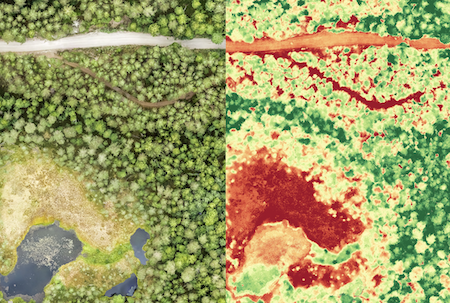
Research points to greenness, or the amount of green space in a neighborhood including trees, plants, forests, parks, having benefits to human health. The relationships between health and greenspace are often discussed using the Normalized Difference Vegetation Index (NDVI), the most commonly used metric in greenspace health.
Normalized Difference Vegetation Index (NDVI)
NDVI uses satellite sensors to measure the amount of red light absorption and near-infrared reflection (NIR) in a given area. These readings rate vegetation on a density value range of -1.0 to 1.0. While NDVI is a consistent metric globally, its readings do not provide specificity around vegetation type and can be difficult to interpret. Because of this, it’s advised to pair NDVI readings with other data sources. Other measures of greenness include the Enhanced Vegetative Index (EVI), which can offer more specificity or variation in urban environments.
Dr. Lane shared a list of papers to learn more about the rapidly expanding field of greenspace health:
- A Review of Epidemiologic Studies on Greenness and Health, Current Environmental Health Reports
- Urban greenspace and dementia: Measures, mechanisms, and methodological guidance, Alzheimer’s & Dementia
- Spatial resolution of Normalized Difference Vegetation Index and greenness exposure misclassification in an urban cohort. Journal of Exposure Science & Environmental Epidemiology
- Calculating access to parks and other polygonal resources: A description of open-source methodologies. Spatial and Spatio-temporal Epidemiology.
- Greenspace with overweight and obesity: A systematic review and meta-analysis of epidemiological studies up to 2020. Obesity Reviews
- A health impact assessment of progress towards urban nature targets in the 96 C40 cities, The Lancet Planetary Health
NDVI Tutorial
The code and data used in this tutorial can be found here:
- Code repository including scripts used in tutorial, CAFE RCC, GitHub
- Data generated by this tutorials code, CAFE RCC Collection, Harvard Dataverse
Before You Begin
This tutorial uses MODIS (Moderate Resolution Imaging Spectroradiometer) as its NDVI data source. In order to download MODIS, users need to create an account with NASA Earthdata. Before beginning, check out a brief overview and some considerations for MODIS and its data collection.
Walkthrough: NDVI and EVI in St. Louis, Missouri
This tutorial presents two methods for processing the greenness data of a specific area using the “luna” R package. The first method extracts greenness values at specific address locations, and the second aggregates greenness to the tract level within a city’s boundaries.
- Script 0: Download Greenness Data
- Script 1: Masking + Summer means
- Script 2: Merging to points
- Script 3A and 3B: Aggregating to tracts
Q&A
In addition to asking questions via chat throughout the webinar, audience members asked about the choice to use fishnets, how the Vegetation Layer is created, considerations for people working with populations living close to water, using NDVI vs EVI, promising practices around adjusting for other variables correlated with greenness, and accommodating for types of greenspace.